Image via Cienpies Design/Shutterstock.com
The Difference Between Men and Women in Government
Recent survey examines federal employee satisfaction levels across race and gender.
Almost two years ago, President Obama issued an executive order establishing a government-wide initiative to promote diversity and inclusion in the federal workforce. The order noted, “Our nation derives strength from the diversity of its population and from its commitment to equal opportunity for all. We are at our best when we draw on the talents of all parts of our society, and our greatest accomplishments are achieved when diverse perspectives are brought to bear to overcome our greatest challenges.”
So what is federal government’s record on diversity and inclusion in the eyes of its employees? Are there employee groups that are experiencing the workplace differently than others? The Partnership for Public Service and Deloitte set out to answer these questions in its latest Best Places to Work in the Federal Government® analysis.
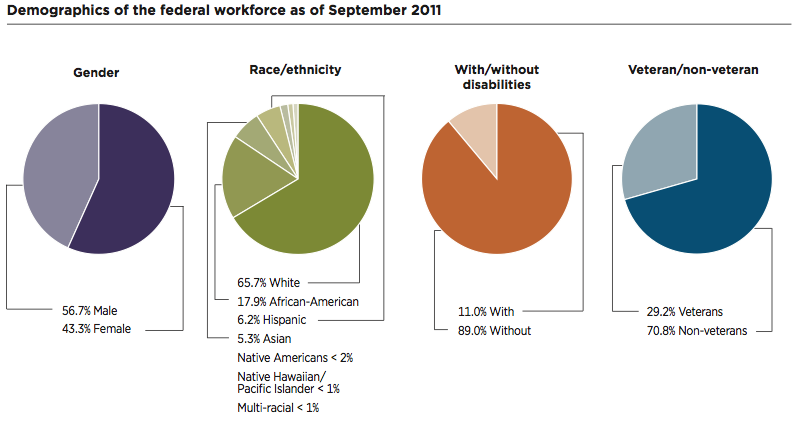
At the broadest level, the federal government is doing a laudable job on these issues, with a few points of concern. Government-wide, there is parity between men and women in overall satisfaction and commitment with their jobs and organizations, with men scoring 64.3 and women scoring 63.9 out of a possible 100. Women, however, expressed lower satisfaction than men by roughly four points in the areas of empowerment and fairness – an issue worth flagging and exploring further.

Likewise, while there was parity in the overall satisfaction and commitment scores among white, black, and Hispanic/Latino employees from across government, scoring 64.4, 64.9, and 64.4 respectively, Native Americans and those employees identifying as multi-racial were less positive, scoring 58.3 and 56.9 respectively. Asian employees expressed the highest satisfaction and commitment levels, scoring 68.8.
While it is a positive sign that many ethnic and racial groups are experiencing the workplace similarly, the data suggests that understanding the perspectives of multi-racial and Native American employees, and why their overall satisfaction and commitment scores are lower, is an important undertaking for agencies.
The data revealed an additional red flag for federal agencies to explore, with employees with disabilities scoring 58.0 on the overall satisfaction and index score, a full 7.2 points lower than employees without disabilities.
In addition to overall satisfaction and commitment scores, we also examined employee perspectives on how well federal agencies convey support for diversity. Federal employees, in aggregate, do not give their agencies particularly high ratings in the “support for diversity” category, with a score of only 55.5 out of 100. White and Asian employees rated the category most highly, with scores of 60.1 and 61.1 respectively, but many minority groups gave much lower marks. Native American and multi-racial employees, in particular, were least positive about support for diversity, with scores of 48.4 and 51.7.
Employees with disabilities also responded less favorably than their colleagues without disabilities when asked about diversity issues. Only a little more than half of employees with disabilities felt their managers worked well with people of different backgrounds and even fewer felt that policies and programs promoted diversity in the workplace. Given the importance of the latter to this administration, there is more work to do.
As revealing as this government-wide analysis is, there is much more insight to be gained by looking at specific agencies, where the results vary considerably. For example, while the satisfaction and commitment score was similar for men and women across government, women were less satisfied by at least four points at agencies like the Departments of Labor and Army. Women were 13.1 points more satisfied than men at the Federal Election Commission.
Agency leaders should examine their survey data to determine whether there are differences in employee perceptions that may be attributed to gender, race and ethnicity, disability status or other differentiating factors. If there are differences, agencies need to take steps to better understand why these employee groups may not be experiencing the workplace the same way as their colleagues, and involve them in developing a strategy to build a more inclusive environment.
Lara Shane is Vice President for Research and Communications at the nonprofit Partnership for Public Service. This article is part of a series on the 2012 Best Places to Work in the Federal Government ® rankings and analysis. For information on your agency’s survey data and how to improve employee satisfaction and commitment at your agency contact Mark Doboga at mdoboga@ourpublicservice.org .
Image via Cienpies Design/Shutterstock.com


