InnaFelker/Shutterstock.com
Where Age Equals Happiness
In the U.S., well-being tends to be highest in a person's earliest and latest years. But elsewhere, new research shows, quality of life follows a very different pattern.
“I’m nearly 70 years old, and I can tell you that bad things begin to happen as you get older,” said Angus Deaton, a professor of economics and international affairs at Princeton University.
This is not, you may be thinking, particularly surprising information.
What is surprising, though, is that in terms of psychological well-being, a person’s later years—even with declining health, even in the face of ageism—tend to be some of their best.
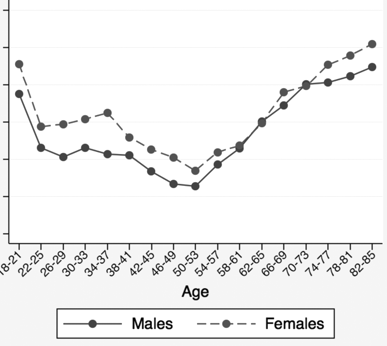
In recent years, a growing body of research has supported the idea that well-being tends to follow a roughly U-shaped curve, peaking in youth and old age and bottoming out somewhere around a person’s 40s or 50s (demonstrated here with data from a 2010 study from the Proceedings of the National Academy of Sciences ):
Well-Being by Age

Proceedings of the National Academy of Sciences
What’s behind the late-in-life upswing? “You accumulate emotional wisdom as you get older. You know, when you’re 25, you go on blind dates with people that, when you’re 50, you know to stay away from,” Deaton said. "You just learn how to live your life better.”
The catch, though, is that a life in San Francisco, for example, may be lived very differently from a life in Santiago or St. Petersburg. As Gallup demonstrated with its World Poll in 2013, the average person’s sense of well-being varies dramatically from country to country—but does the pattern itself hold true across borders?
In a study published yesterday in The Lancet , Deaton and researchers from University College London, Stony Brook University, and the University of Southern California put the U-shaped curve in context by looking at the relationship between age and well-being across four different groupings: wealthy English-speaking countries, eastern Europe and former members of the Soviet Union, sub-Saharan Africa, and Latin America and the Caribbean.
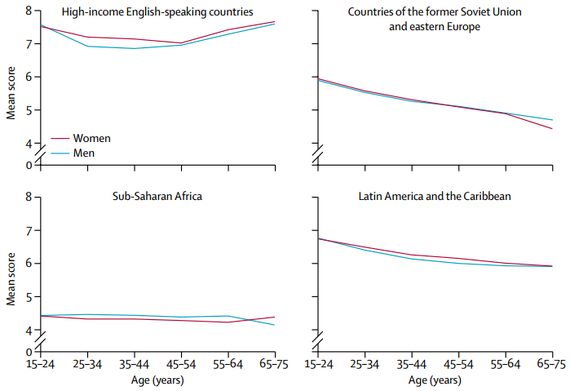
Looking at data from the Gallup World Poll, which measured well-being in different countries, and the English Longitudinal Study , they found that not all patterns of well-being are created equal. While the U.S. and similar nations did indeed stick to the U-shaped curve, elsewhere around the globe, the relationship between age and overall life satisfaction looked markedly different:
Life Satisfaction by Age

The Lancet
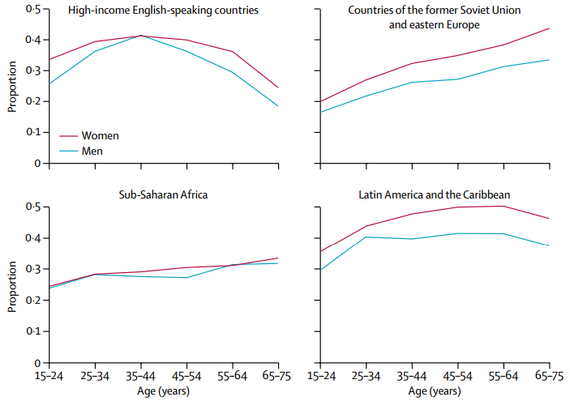
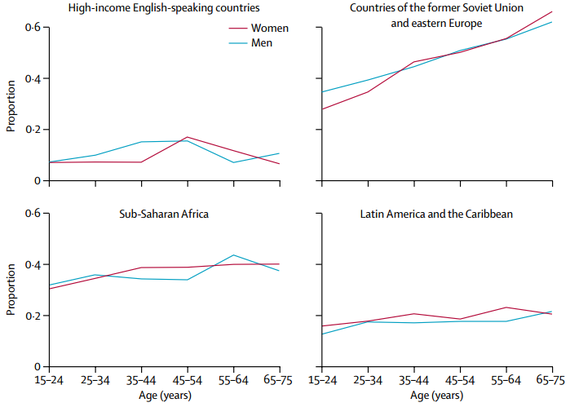
In addition to overall life satisfaction, or “evaluative well-being,” the researchers also looked at “hedonic well-being”—the measurement of more immediate day-to-day feelings—by charting people’s response to the levels of worry and unhappiness they had experienced the day before. There, too, the age breakdown differed dramatically from place to place:
Worry by Age

The Lancet
Unhappiness by Age

The Lancet
While the study didn’t go into why these geographic discrepancies exist—“your guess is as good as mine,” Deaton said—he did offer a few common-sense theories. “In the high-income English-speaking world, the elderly get treated very well indeed,” he said; in places with poor healthcare, no social safety net, or cultural disdain for the old, by contrast, the negatives of aging may outweigh the perks of “emotional wisdom.”
But, he added, the particular distribution of each well-being curve is likely generation-specific, with present-day feelings shaped at least partially by the events a person has witnessed over his or her lifetime. With the former Soviet Union countries, for instance, “The collapse of communism was terrific for younger people, who could come to the United States, go to graduate school, all those sorts of things,” he explained. “But for older people, they lost a lot of their pensions, they lost a lot of their healthcare. So it was very bad for them, and you can see a sharp decline with age.”
A generation from now, in other words, the relationship between age and well-being—across the board—will likely look different still.
( Top image via InnaFelker / Shutterstock.com )


